

Housing and Neighborhoods
Spanish Lake is a stable but evolving suburb. Rising home values and renewed market growth are good signs for positive momentum, and challenges include high vacancy rates and changing homeownership patterns.
All data sources can be found in the full report.

Key Takeaways
Spanish Lake’s future depends on taking care of the homes and neighborhoods that already exist.
Home values are rising, but older homes, vacancies, and changing ownership create uneven conditions.
With nearby parks and new investments like the Saint Louis Zoo WildCare Park, there are real opportunities to improve quality of life.
By improving homes and investing in key areas, Spanish Lake can grow stronger for current residents while attracting new people.
Housing Market Inventory
Household Size
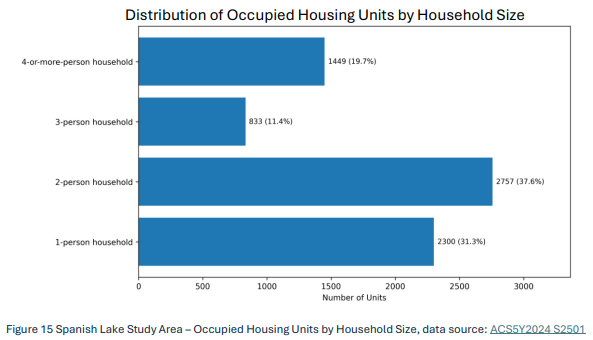
Household composition in Spanish Lake based on ACS 5-Year 2024 estimates (S2501) shows a large number of smaller households. There are approximately 2,300 single-person households, along with a significant number of two-person households. However, this demand is not fully matched by the available housing stock. Only 926 occupied units have one bedroom, indicating that many smaller households are living in larger two- and three-bedroom homes. This pattern likely reflects long-term residency as household sizes change over time, but it also points to a limited supply of smaller housing options within the community.
Housing Unit Size by Bedrooms
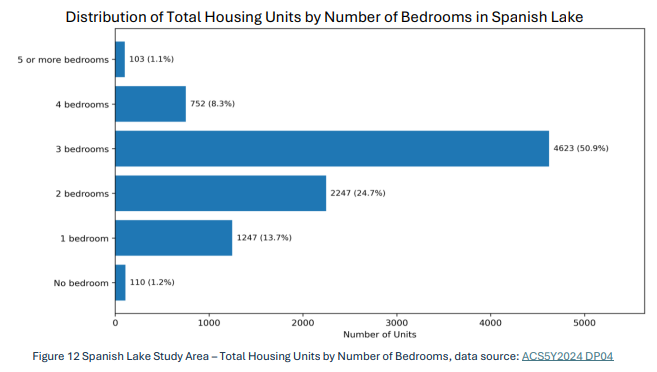
The distribution of housing units by number of bedrooms shows that Spanish Lake’s housing stock is largely designed for small to moderate-sized families. Three-bedroom homes make up most units at 50.9 percent, while two-bedroom homes account for another 24.7 percent. Together, these unit types represent about three-quarters of all housing, reflecting the dominant housing patterns established during the mid-twentieth century.
Larger homes with four or more bedrooms make up a smaller share of the market, and smaller units are limited. About 13.7 percent of homes have one bedroom, and only 1.2 percent have no bedrooms. Overall, this mix reinforces a housing stock that is consistent and family-oriented, but with fewer options for smaller households or individuals, which may influence how well the housing supply meets the needs of a changing population.
Cost Burdened Renters and Owners
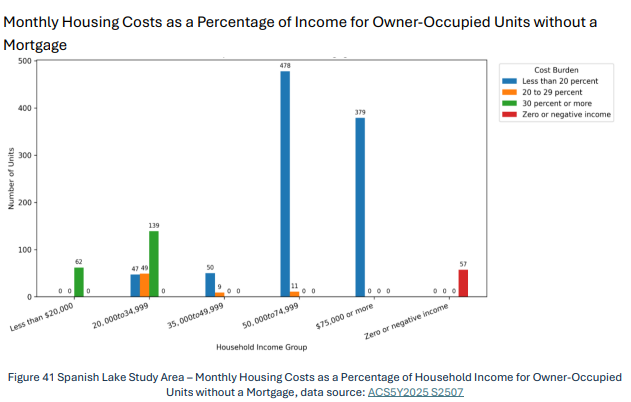
Monthly housing costs for owners without a mortgage are generally lower than for mortgaged households. Approximately 92 percent pay less than $1,000 per month, with 56.8 percent paying between $600 and $999. These costs typically include property taxes, insurance, and utilities. For households earning above $35,000, these expenses generally represent less than 20 percent of income.
Affordability conditions differ for lower-income households. Approximately 27 percent of mortgage-free owners earn below $35,000, and cost burdens are more prevalent within this group. Households earning below $20,000 generally allocate a larger share of income to housing-related costs, with many exceeding 30 percent, while households in the $20,000 to $34,999 range also show elevated cost burden levels.
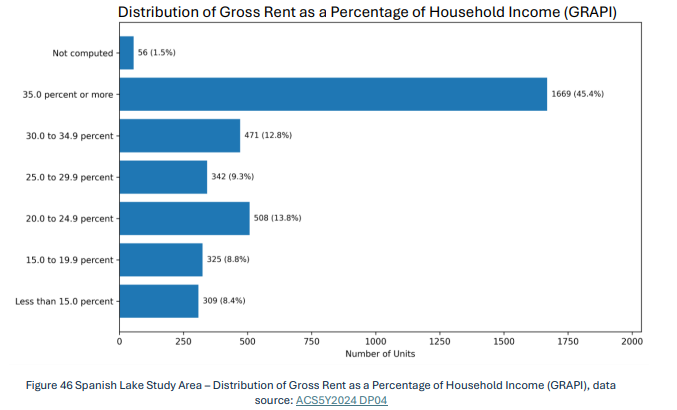
Spanish Lake households generally have lower incomes than those in the surrounding region. Because rents in Spanish Lake remain comparable to the regional median despite these lower income levels, a substantial share of households must allocate a significant portion of their earnings toward housing. This financial pressure limits their capacity for other essential household expenses and financial stability. Therefore, the housing cost burden in Spanish Lake is primarily driven by income constraints rather than excessive rent levels. And strategies focused solely on rent control or subsidies may be insufficient without parallel efforts to address the income gaps facing renter households.
Vacancy Overview
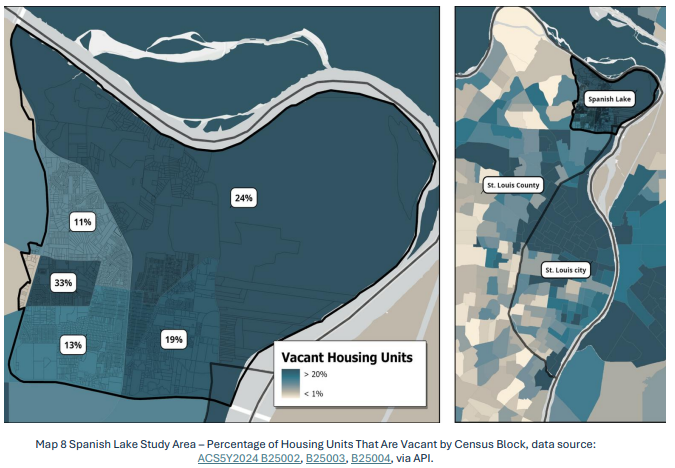
According to ACS 5-year (2024) data, Spanish Lake has 1,743 vacant housing units out of a total of 9,082 units, representing a vacancy rate of approximately 19.2 percent.
Parcel-level data from 2026 provides additional context, indicating that approximately 11.7 percent of all parcels are classified as vacant or agricultural land, suggesting that a portion of land has transitioned out of residential use. The spatial distribution of vacancy is not uniform across the study area. For example, Census Tract 2107.04 has a vacancy rate of approximately 33 percent, while Tract 2101.01 has a vacancy rate of approximately 24 percent. These concentrations indicate that vacancy is more prevalent in certain areas, where it may influence neighborhood conditions and redevelopment potential.
Household Characteristics
A Predominantly Black Community in Racially Divided Region
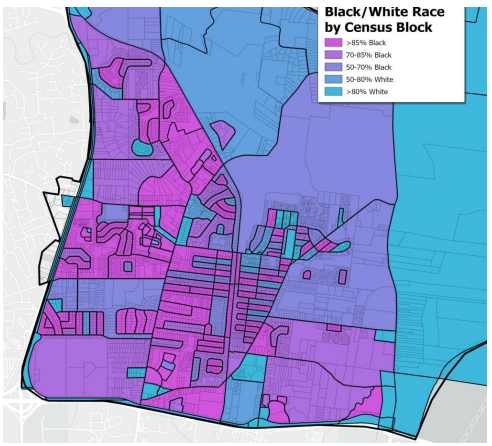
Most residential blocks in Spanish Lake are predominantly Black, with concentrations
generally between 70 percent and 85 percent. The clearest shift appears along the eastern edge of the study area, particularly toward the northeast, where majority-white blocks begin. This pattern reflects broader regional settlement and development trends in North St. Louis County.
An Aging Population, but Younger in Regional Context
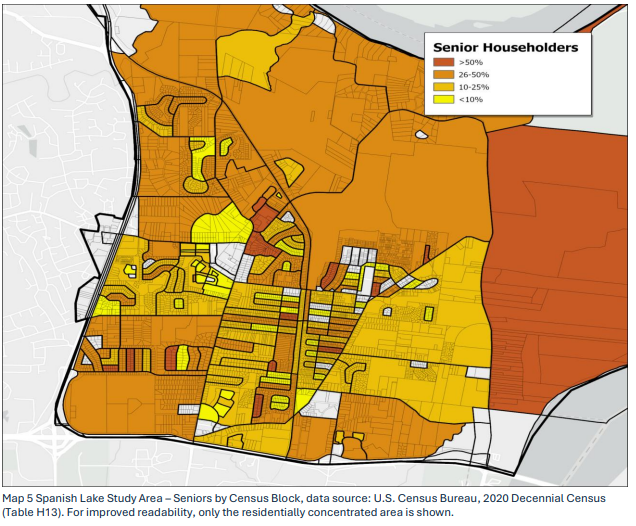
Aging is a widespread condition across Spanish Lake rather than a localized trend. Most residential blocks have senior householder concentrations between approximately 26 and 50 percent, with several exceeding 50 percent. At the household level, 34.9 percent of all households include at least one person age 60 or older, and 10.1 percent consist of older adults living alone. These patterns are consistent with a significant number of long-term residents aging in place.
Issues
High Vacancy Hurts Neighborhood Stability
Many homes are empty (about 19% across the Spanish Lake study area). This lowers nearby home values and can make blocks feel less safe.
Empty homes can also lead to neglect, trash, and more crime. Over time, this can reduce neighborhood pride and make it harder to attract new investment.
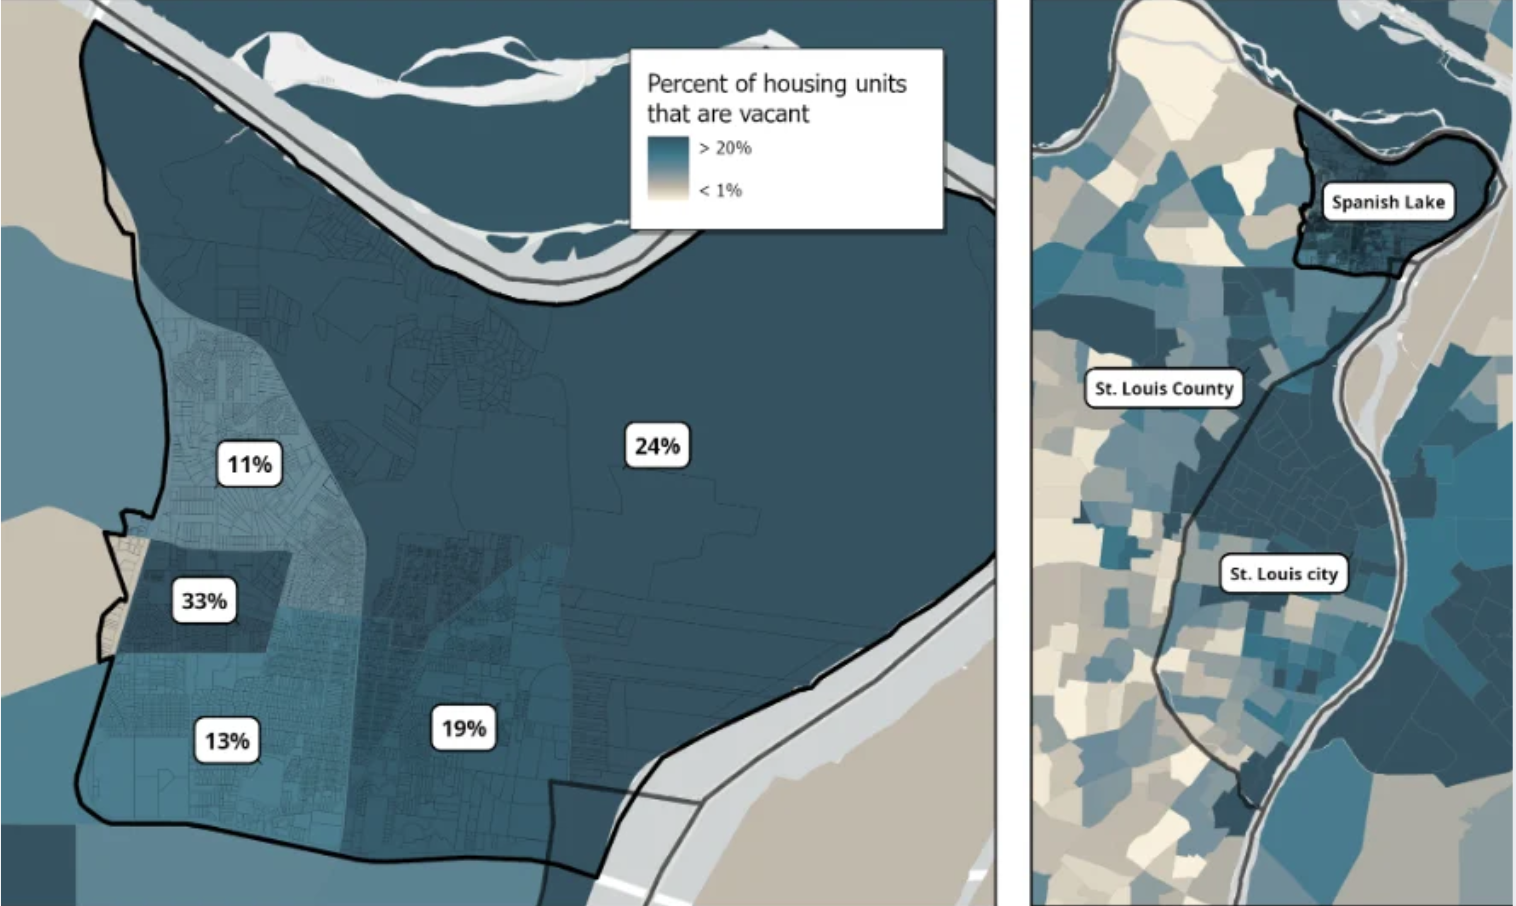
Spanish Lake Study Area – Percentage of Housing Units That Are Vacant by Census Block, data source: ACS5Y2024 B25002, B25003, B25004, via API
Aging Homes Need Repairs
Most homes in Spanish Lake were built between 1940 and 1979, and many need updates and repairs.
Without regular maintenance, homes can become unsafe and lose value. This can also make it harder for homeowners to afford ongoing costs.
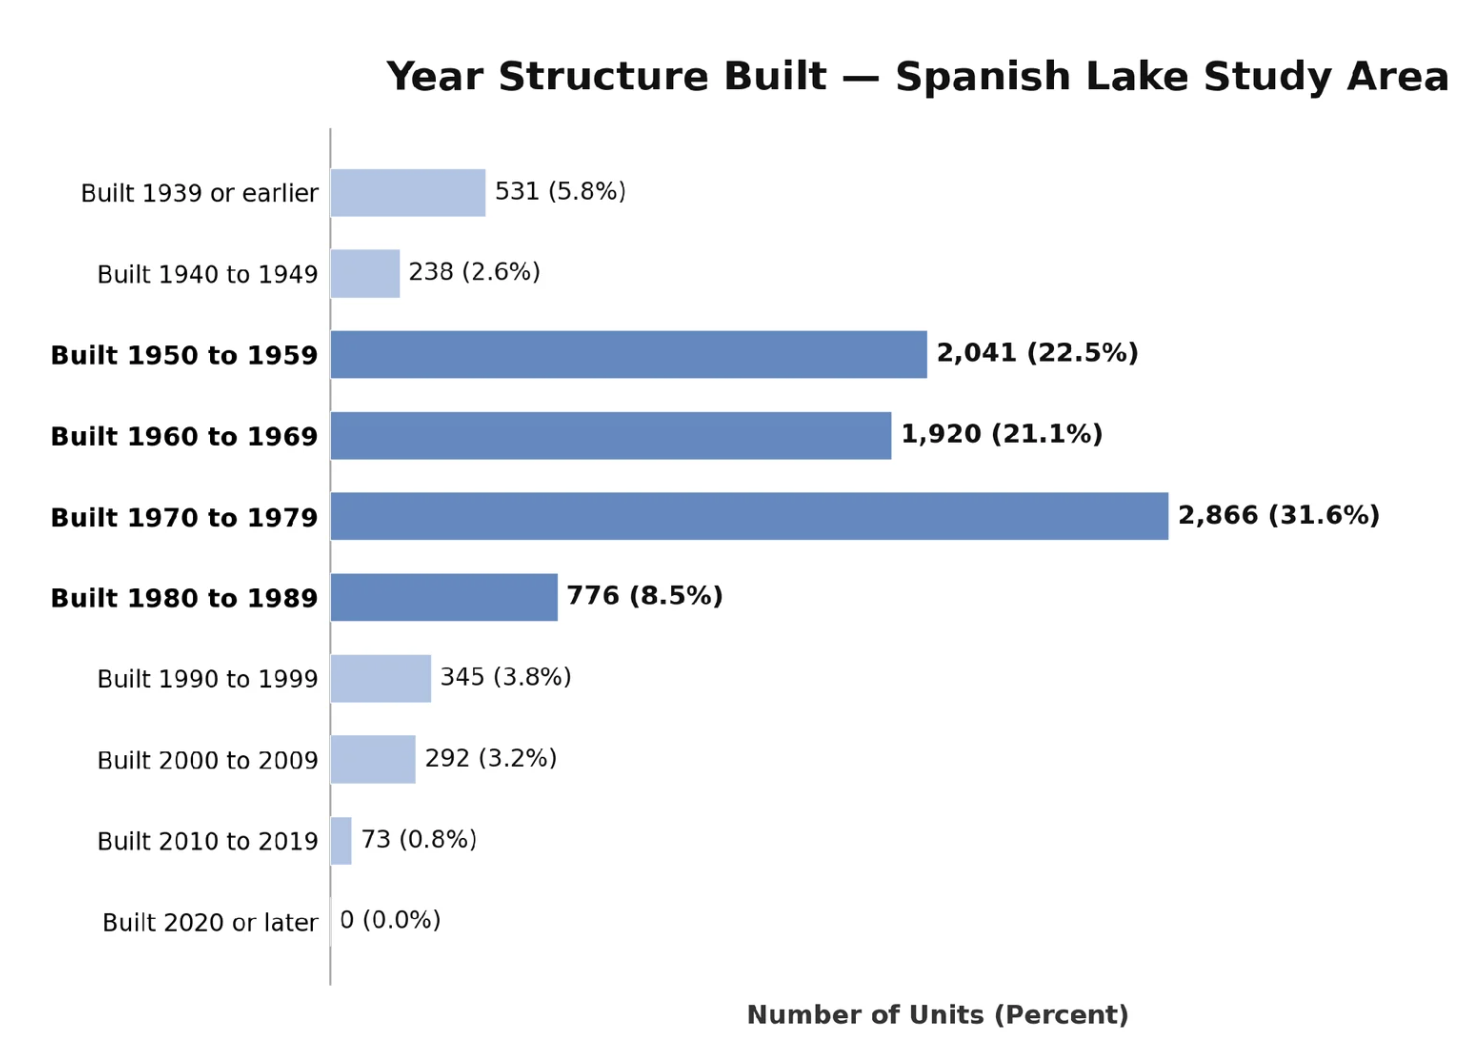
Spanish Lake Study Area – Distribution of Total Housing Units by Year Built, data source: ACS5Y2024 DP04
Homeownership Is Decreasing
Homeownership in Spanish Lake has declined over time, with more homes now used as rentals.
In 2011, 69% of homes were lived in by homeowners. In 2026, 55% of homes are lived in by homeowners.
This decline can lead to less long-term care and investment in properties. It may also affect neighborhood stability and reduce connections among residents.
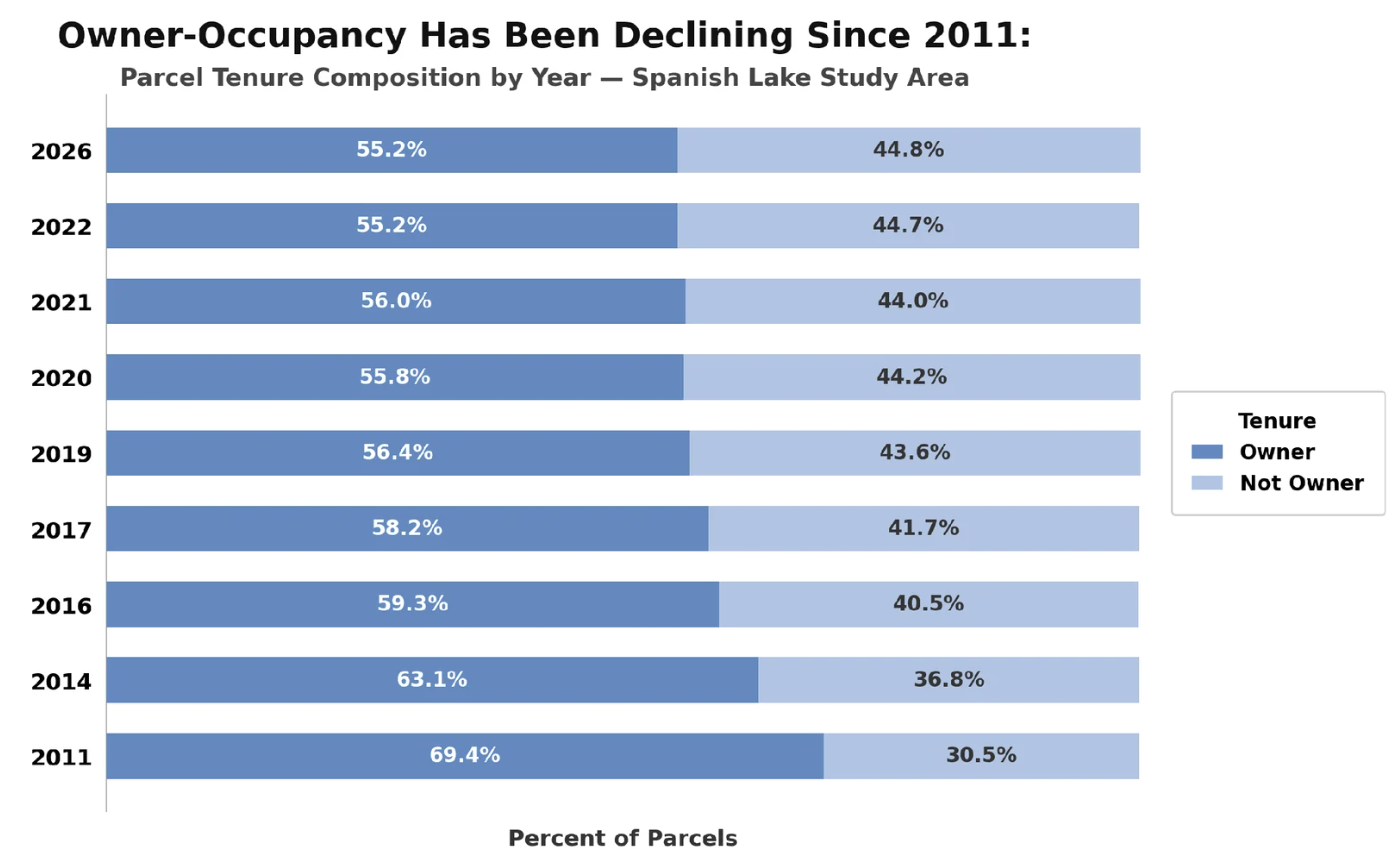
Spanish Lake Study Area – Parcel Tenure Composition by Year, data source: 2026 St. Louis County Parcel Data
More Homes Are Owned by Investors and Companies Out of State Instead of Residents
About one-third of homes are owned by companies or investors, many from out of state. This can make it harder to fix problems quickly and keep homes in good condition. It may also limit local control and reduce chances for residents to build wealth.
The below map shows the top 7 out-of-state corporate owners of single-family homes in Spanish Lake (see the colored parcels). This map does not show all of the out-of-state single-family home owners.
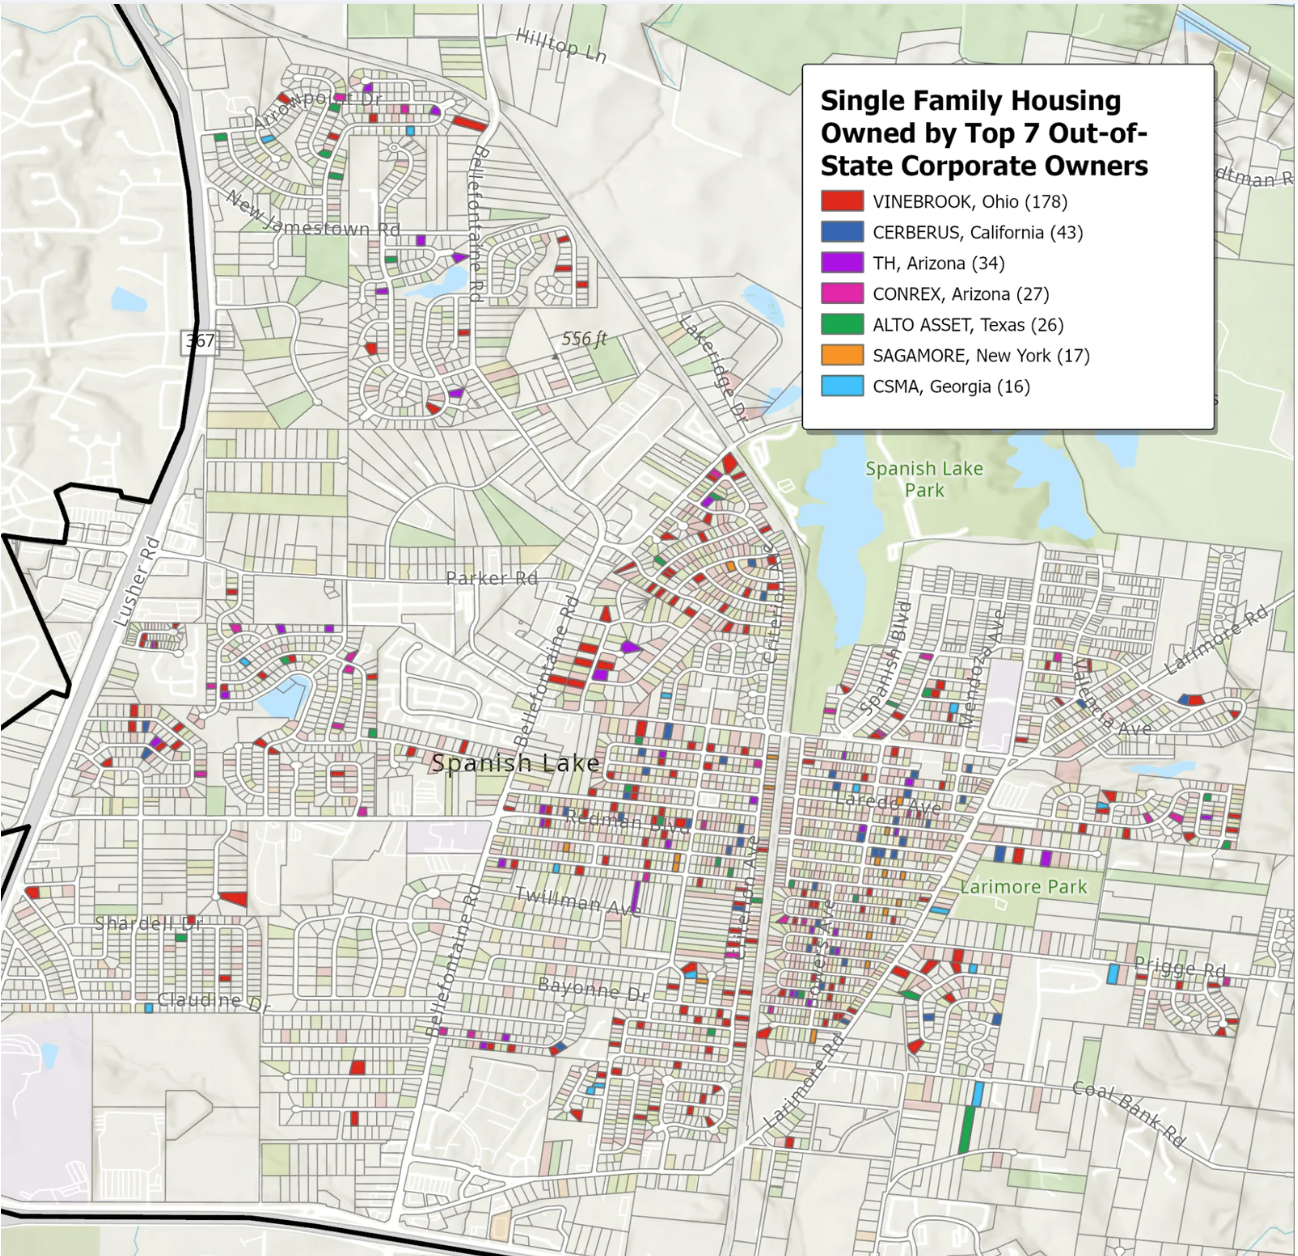
Spanish Lake Study Area – Single Family Housing Owned by Top 7 Out-of-State Corporate Owners, data source: 2026 St. Louis County Parcel Data
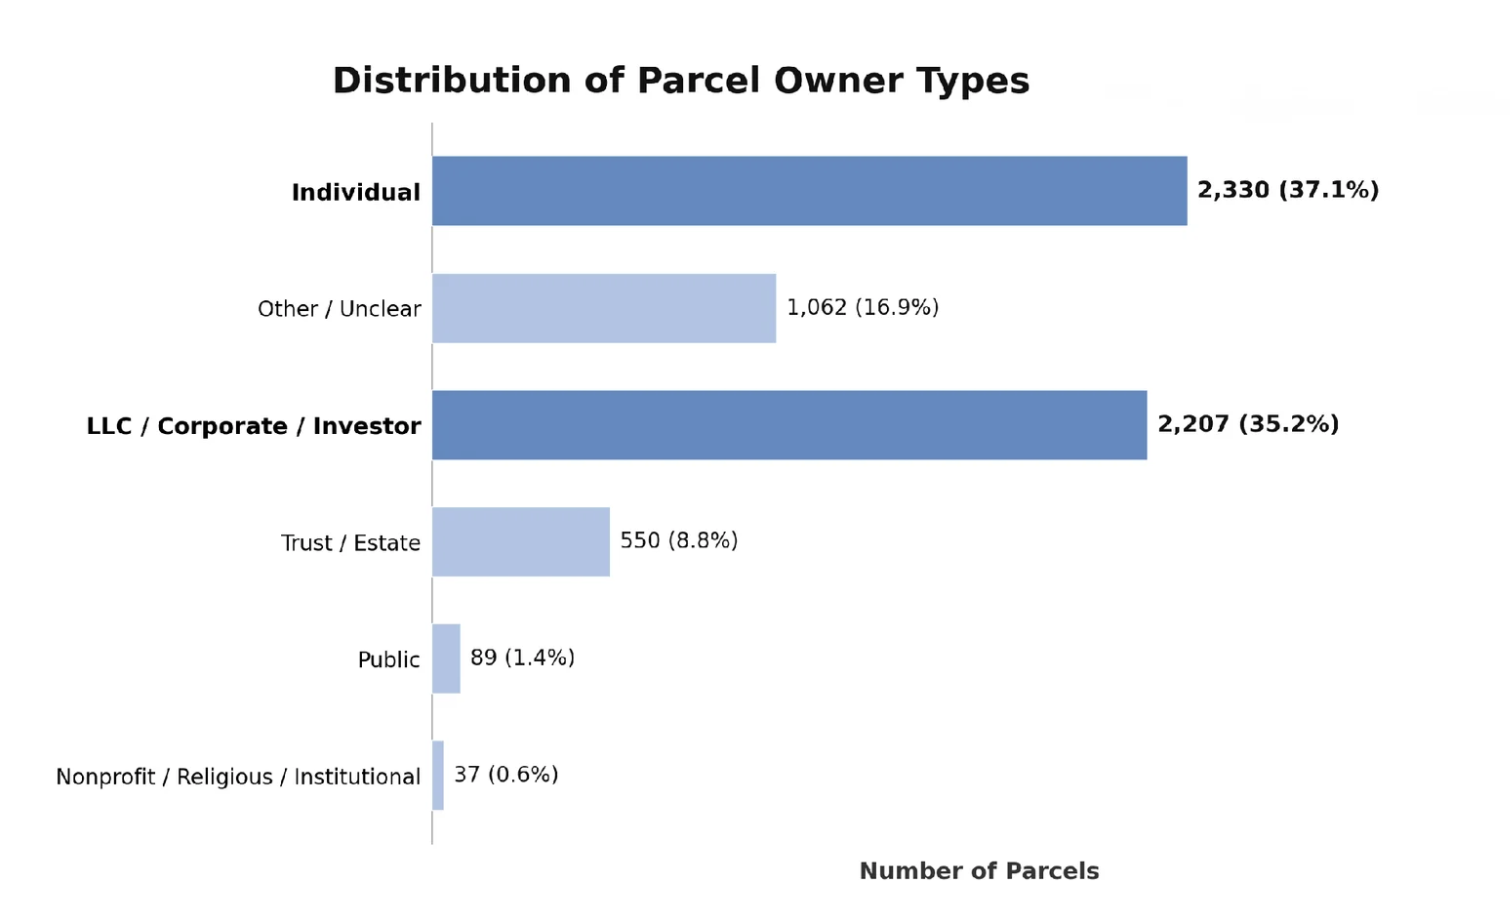
Spanish Lake Study Area – Distribution of Parcel Owner Types, data source: 2026 St. Louis County Parcel Data
Property Crime Impacts Perception, Safety, and Wellness
Theft and vandalism affect how residents feel about their neighborhood. These incidents may contribute to stress and concerns about safety, impacting overall physical, social, and emotional wellness.
They can also make some residents, including older adults and youth, feel less comfortable spending time outside participating in leisure, athletic, and recreational community activities.
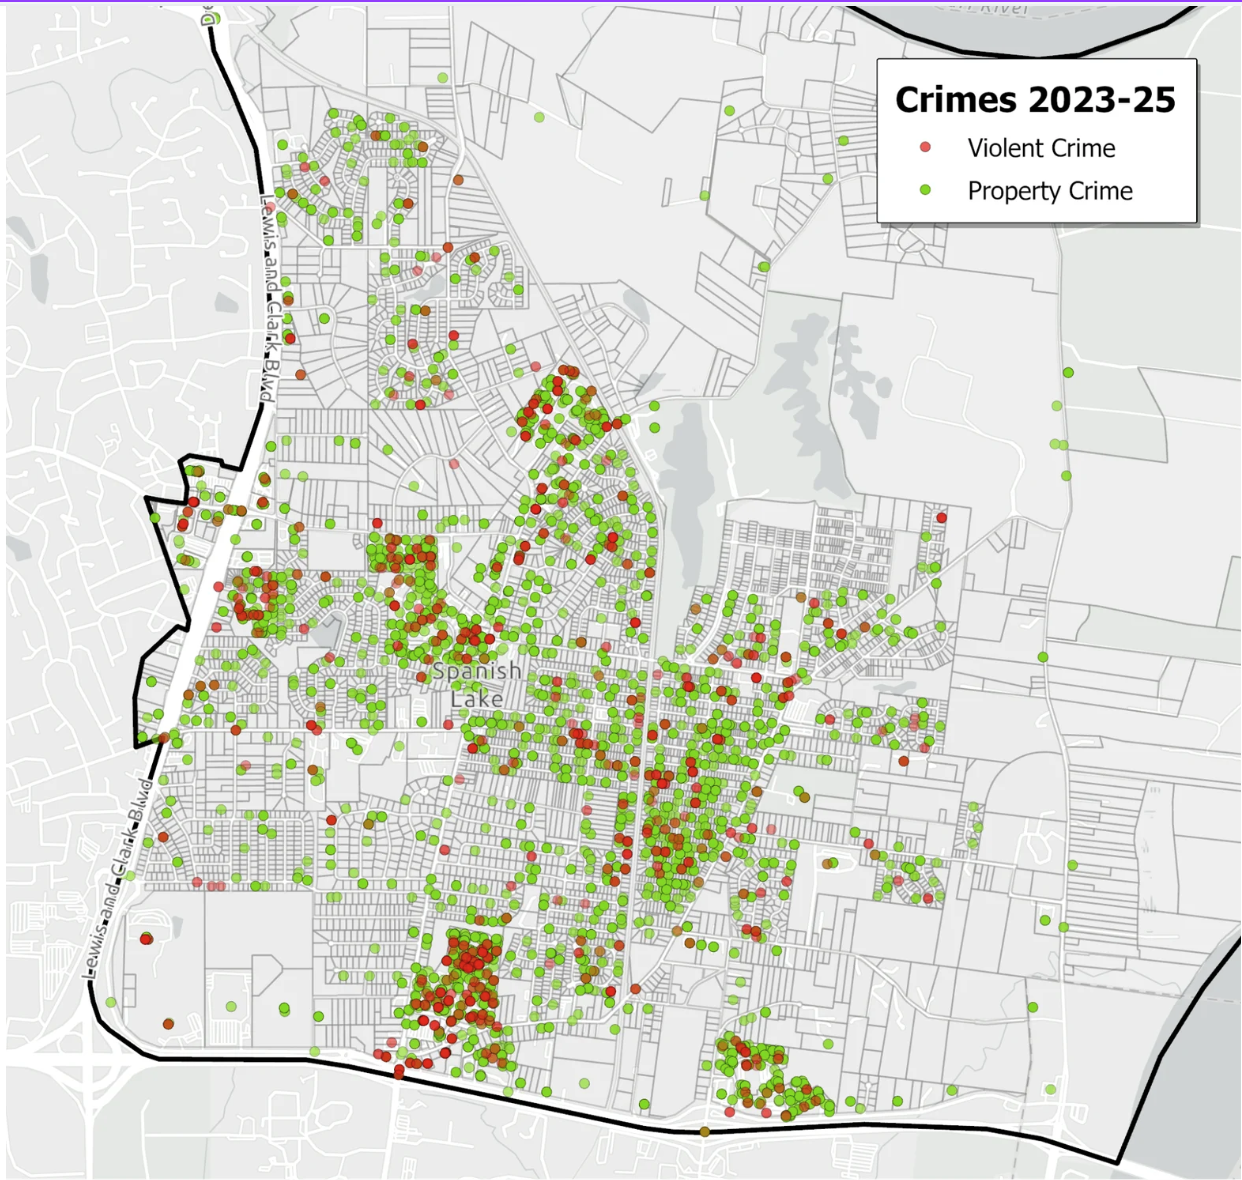
Spanish Lake Study Area – 2023-2025 Violent Crime, Property Crime, data source: St. Louis County NIBRS Crime Data (2023–2025)
Spanish Lake Has Fewer Larger Homes for Growing Families
Spanish Lake has around the same number of 3-bedroom homes but fewer larger homes than the surrounding areas. This can make it harder for growing families to stay in Spanish Lake as their space needs change.
It can also create challenges for multigenerational households, including those in the “sandwich generation” who are caring for children and aging parents at the same time. Many homes may not offer enough room for family life, caregiving, and privacy.
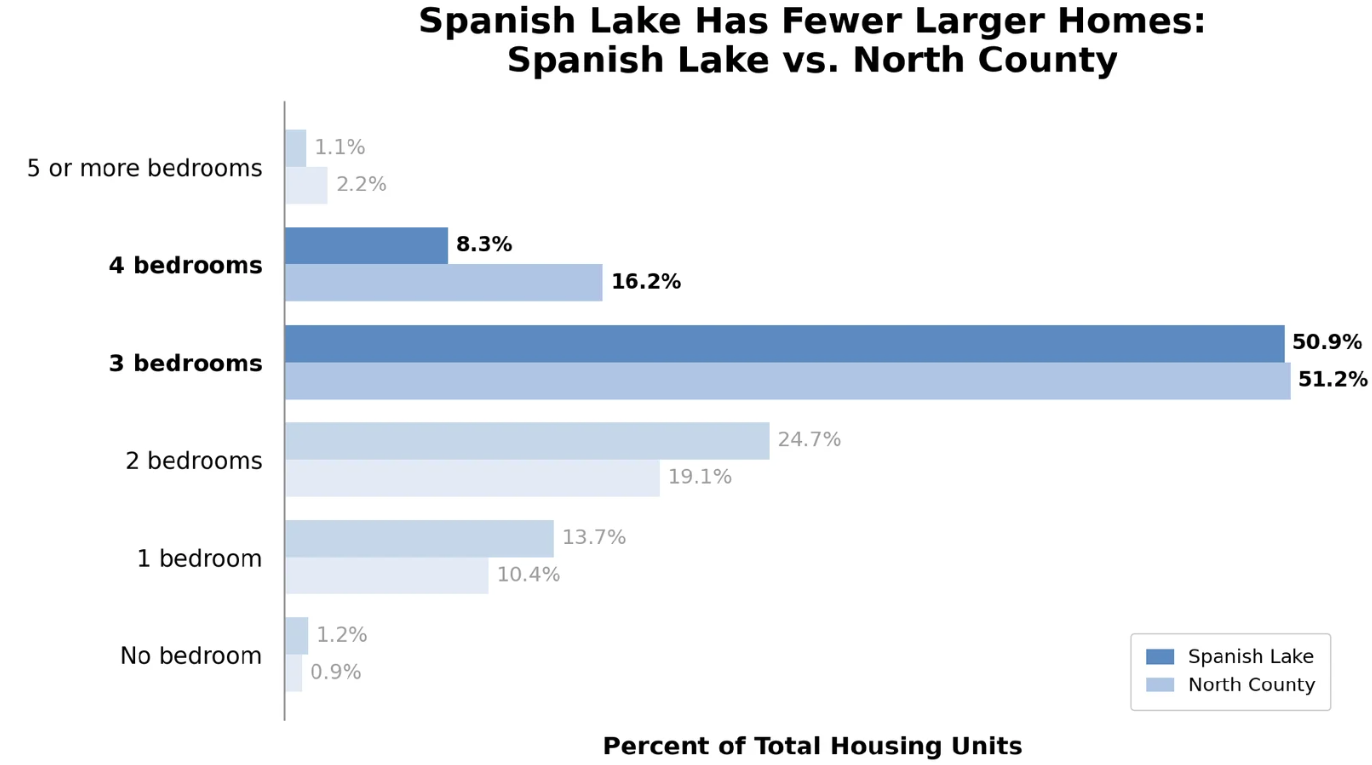
Spanish Lake Study Area vs. North County Comparison Area – Distribution of Housing Units by Number of Bedrooms, data source: ACS5Y2024 DP04
Lower Rents, But Ongoing Cost Pressure for Renters
Rents in Spanish Lake are somewhat lower, but many renters still face challenges. A larger share of renters spend a high portion of their income on housing. This suggests that lower incomes not just rent levels are a key factor affecting affordability.
The below chart shows that there are fewer high-earning households in Spanish Lake than in similar areas of North County, and more households with lower income in Spanish Lake than in similar areas of North County.
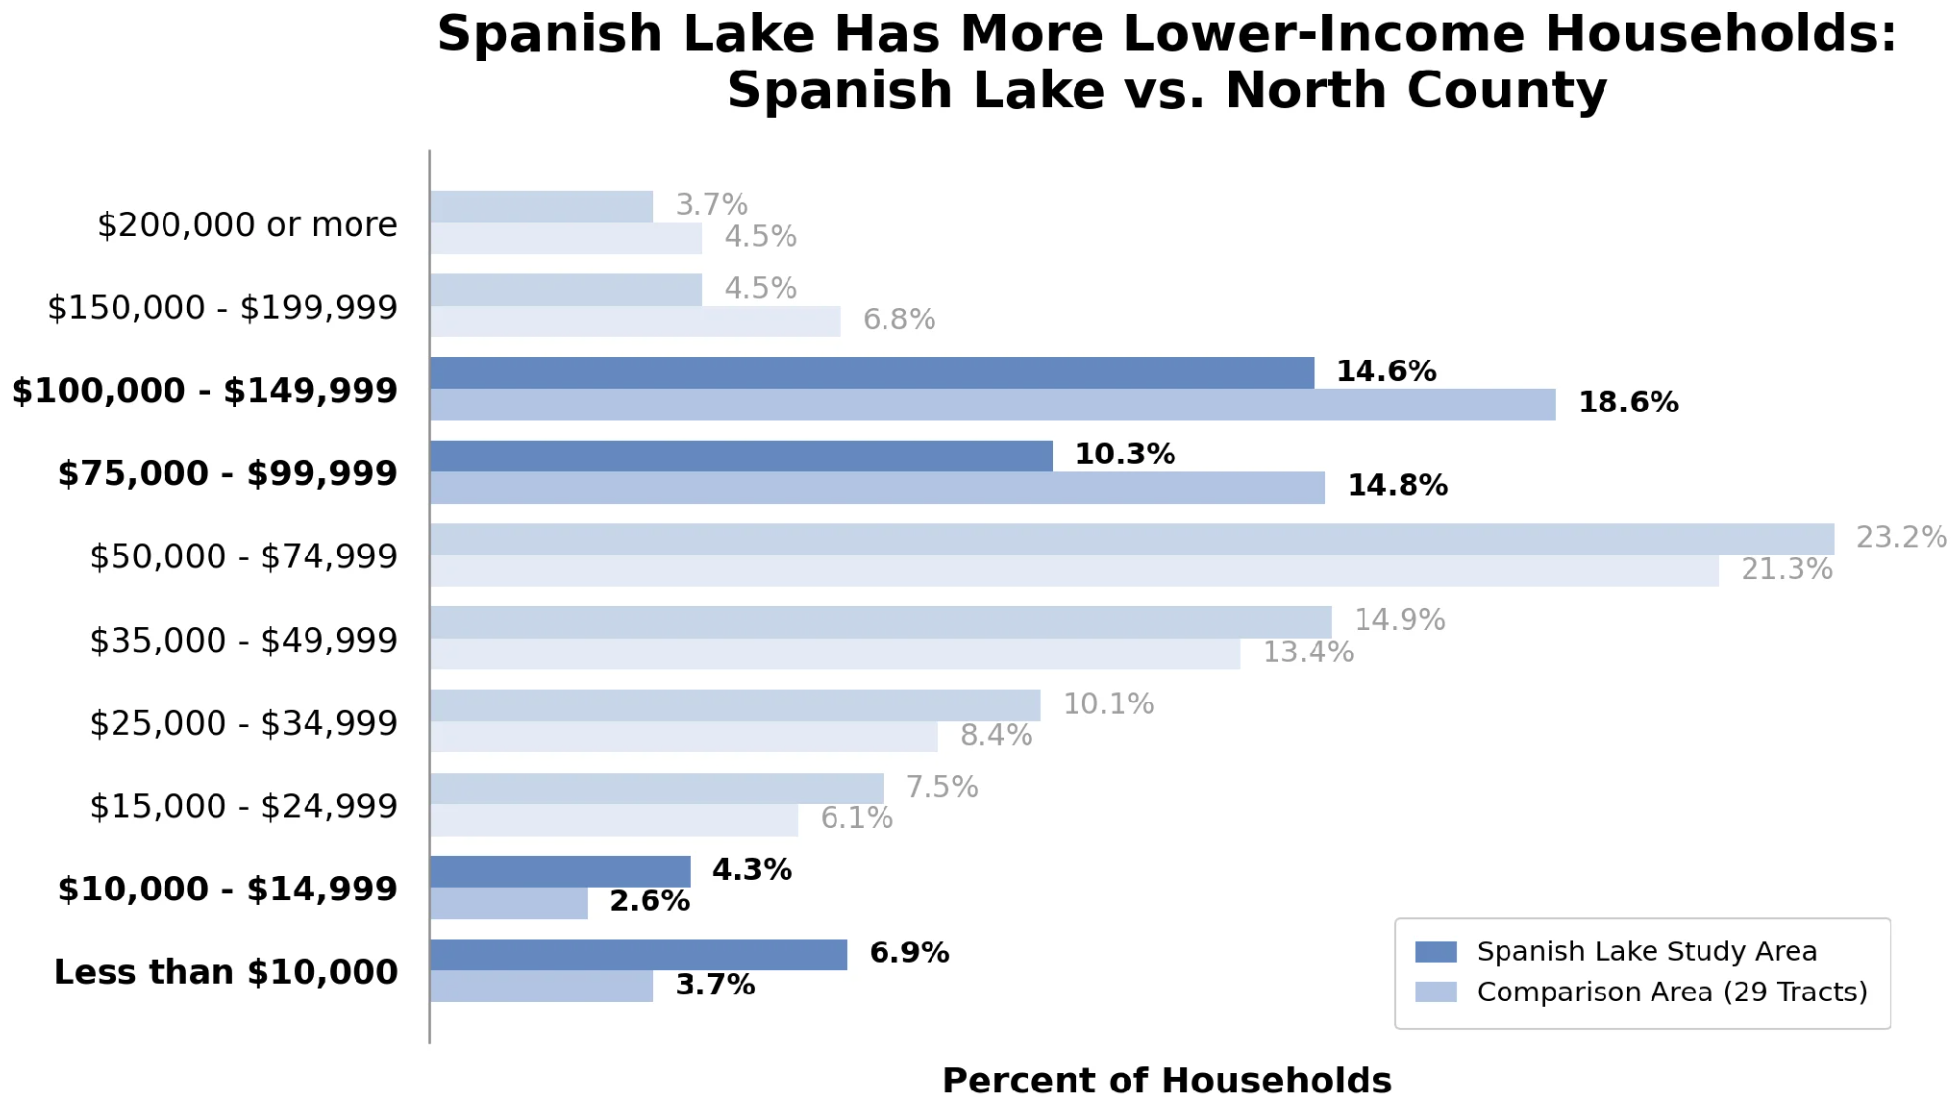
Spanish Lake Study Area vs. North County Comparison Area – Distribution of Household Income, data source: ACS5Y2024 S1901
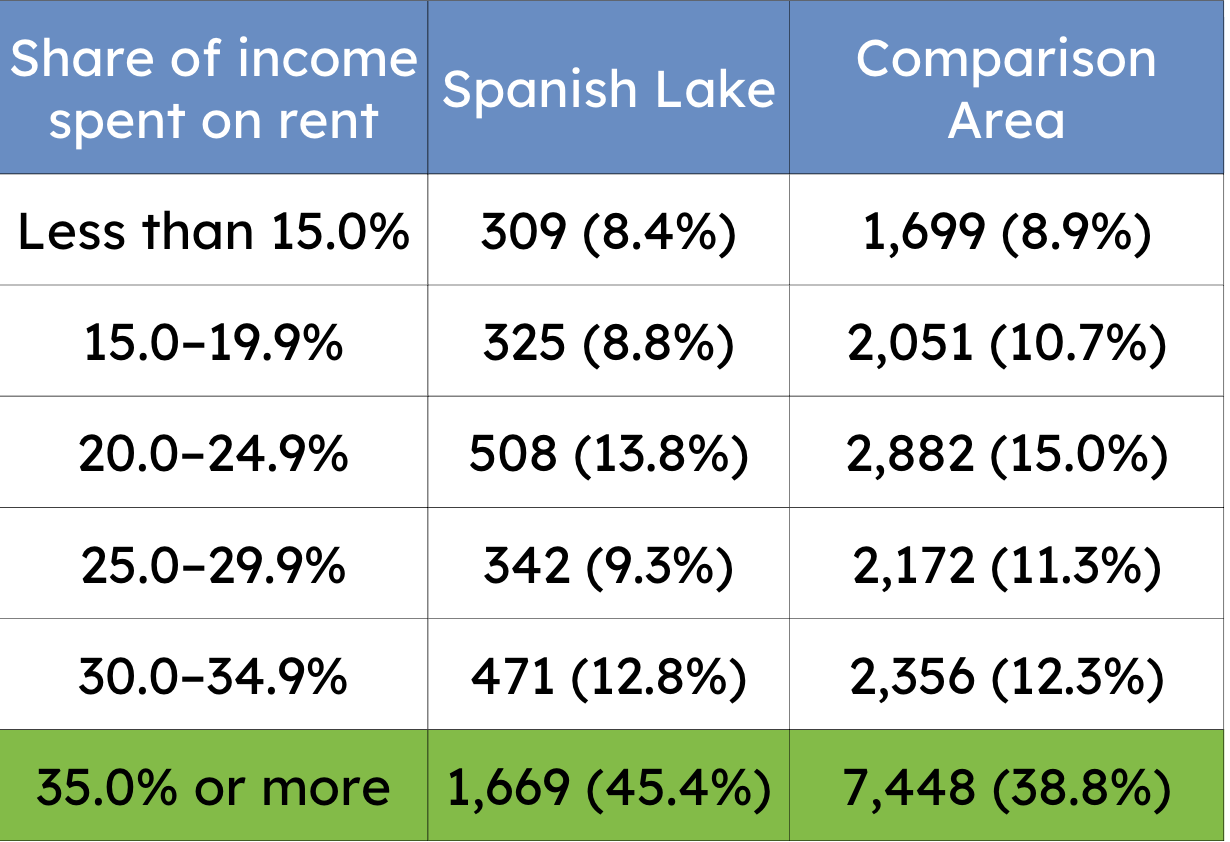
Spanish Lake Study Area vs. North County Comparison Area – Rent as a Percentage of Household Income, data source: ACS5Y2024 DP04
Home Values Are Recovering, But Some Areas Are Lagging
Home values in Spanish Lake have risen in recent years, which is a positive sign. However, that progress is not consistent across the community. Some blocks are seeing stronger gains and reinvestment, while others continue to experience lower values and limited investment.
These uneven conditions can slow overall neighborhood stability and make it more difficult for the community to move forward together.
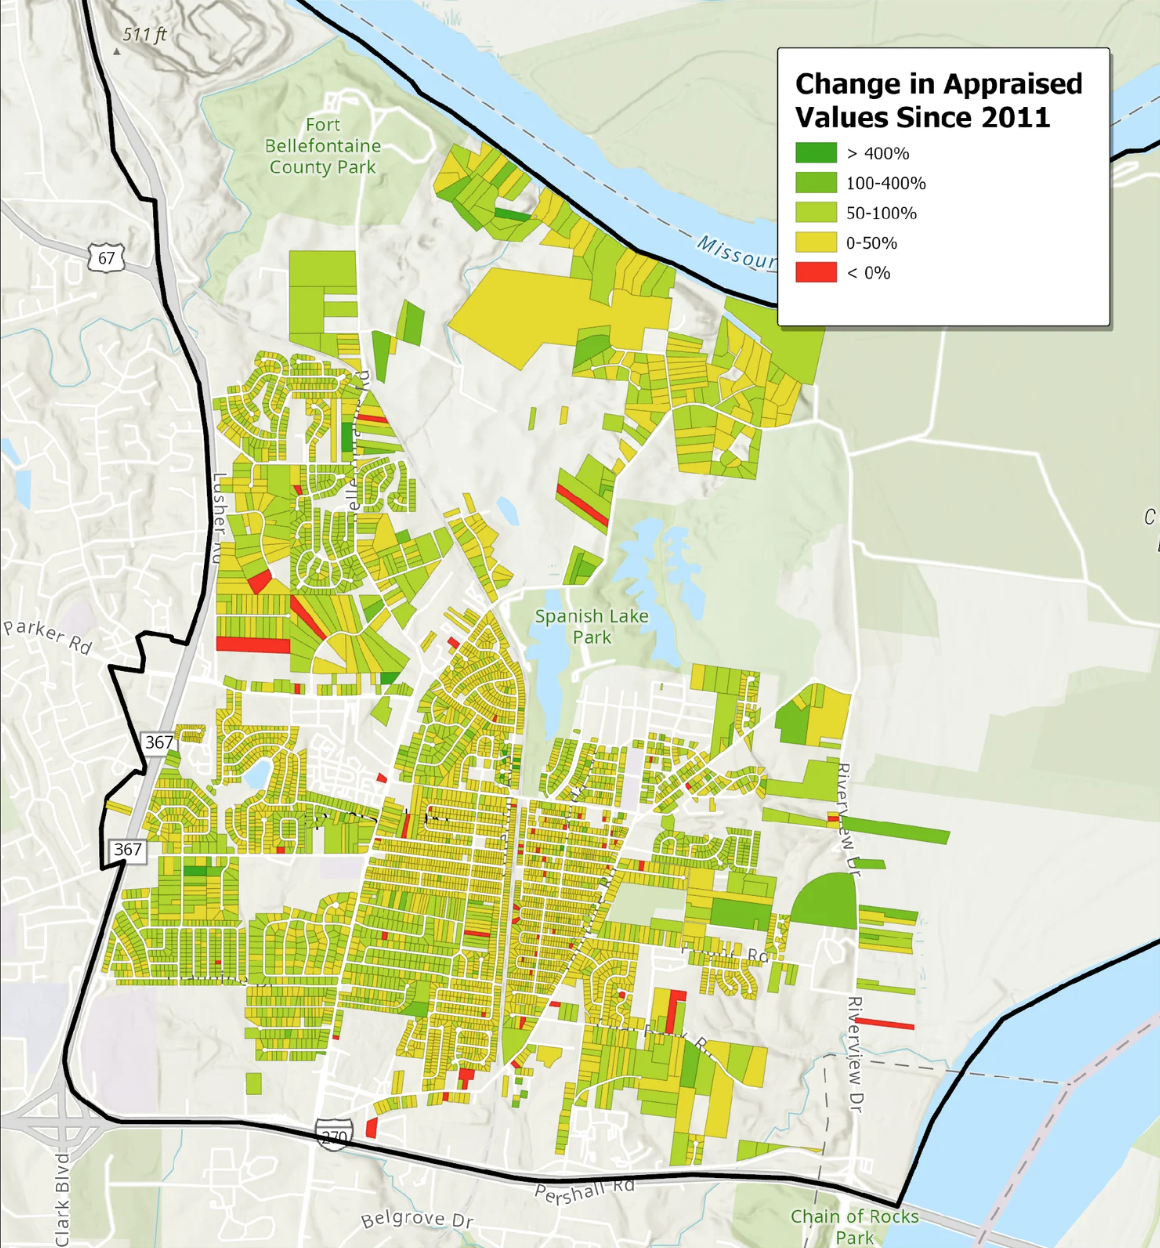
Spanish Lake Study Area – Change in Appraised Home Values Since 2011, data source: 2011- 2026 St. Louis County Parcel Data
Opportunities
Vacant Land Can Support New Development
Spanish Lake is part of a larger North St. Louis County area made up of 29 census tracts north of Highway 367 and Highway 267, focused on residential communities rather than airport or industrial areas.
Compared to nearby areas, Spanish Lake has higher vacancy and lower homeownership, but also a strong mix of families and long-term residents, creating both challenges and opportunities for stability and growth.
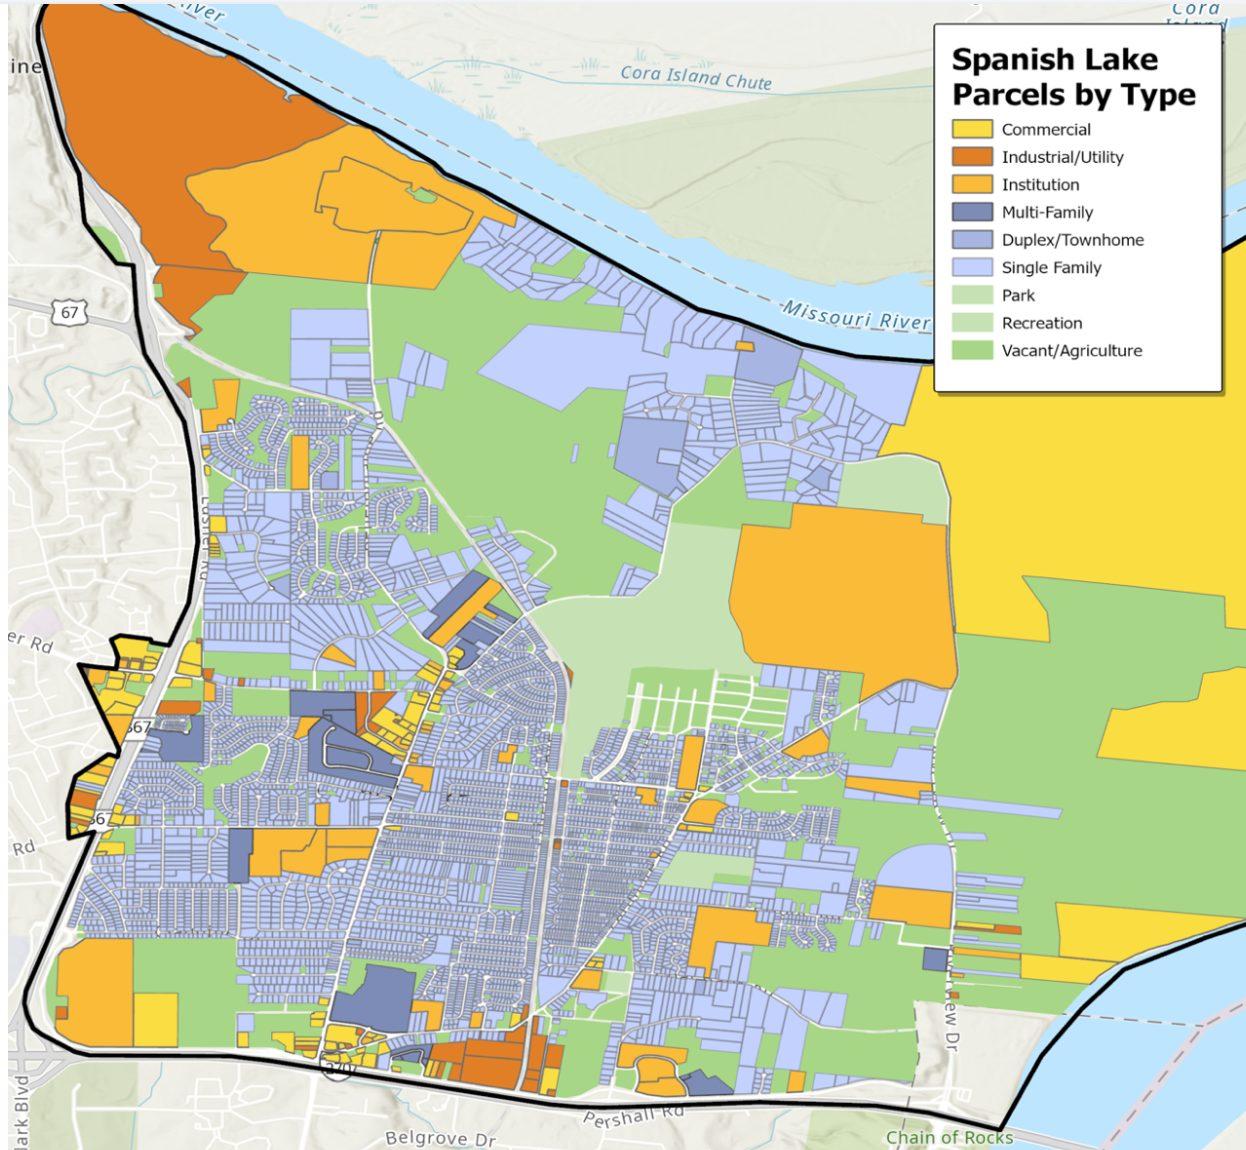
Spanish Lake Study Area – Parcels by Type, data source: 2026 St. Louis County Parcel Data
Build on a Younger Family Presence
Spanish Lake has a higher share of households with children and a smaller share of older households compared to other areas in North County.
This creates an opportunity to retain and attract younger families by providing safe, quality housing along with quality schools, parks, and everyday services.
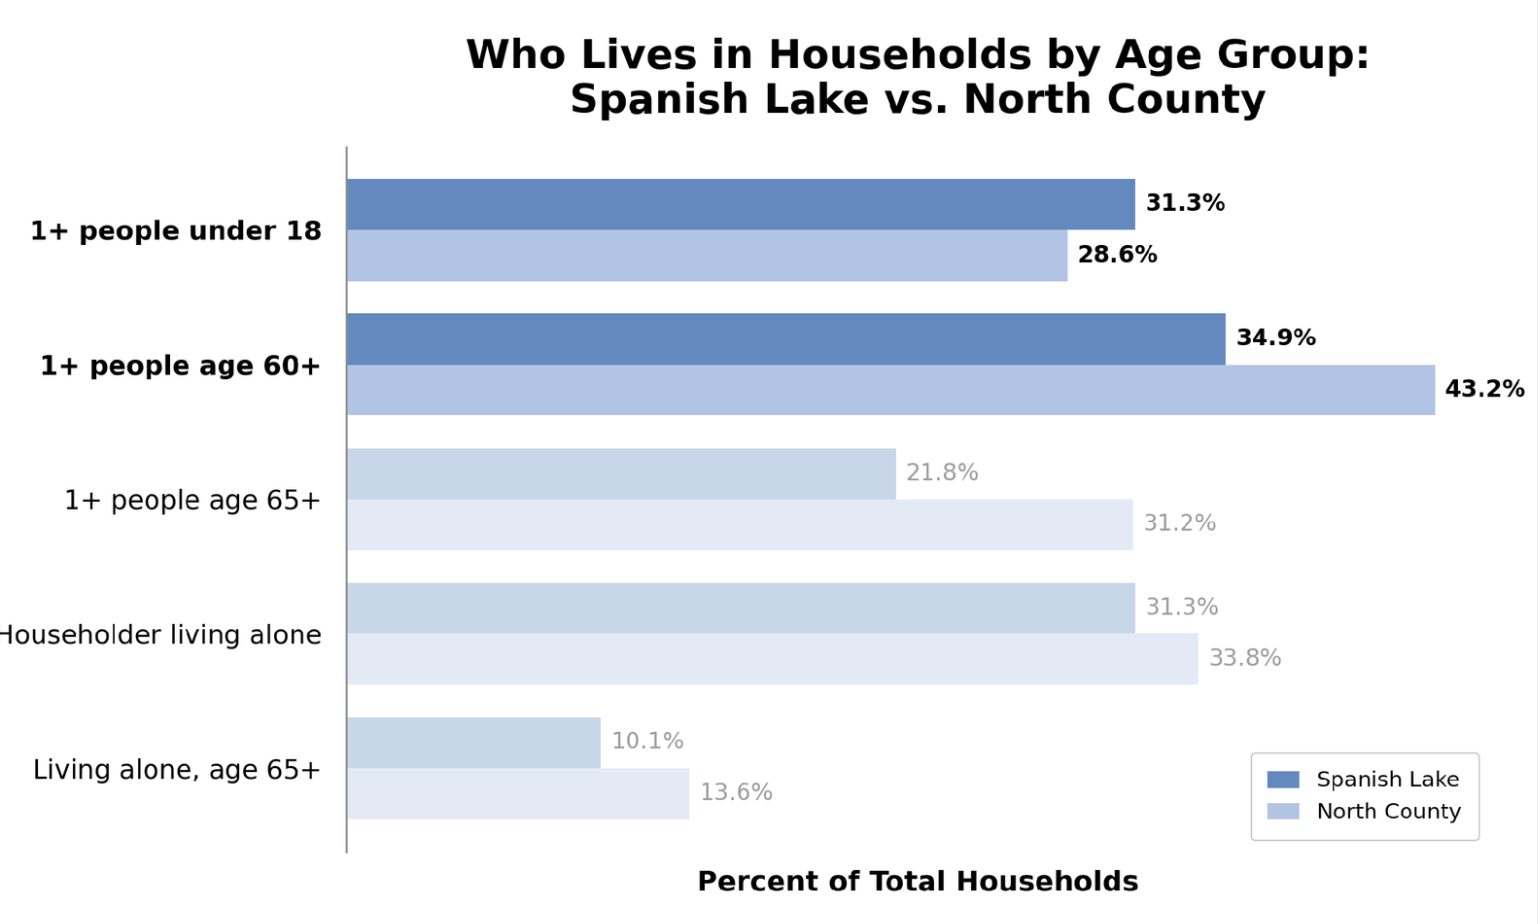
Spanish Lake Study Area vs. North County Comparison Area – Selected Household Type Distribution, data source: ACS5Y2024 S1101
Support Early Childhood Through Stable Housing
Spanish Lake has a slightly higher share of households with very young children compared to the surrounding area.
This creates an opportunity to support early childhood by providing safe, stable, and affordable housing, with better access to early learning and care.
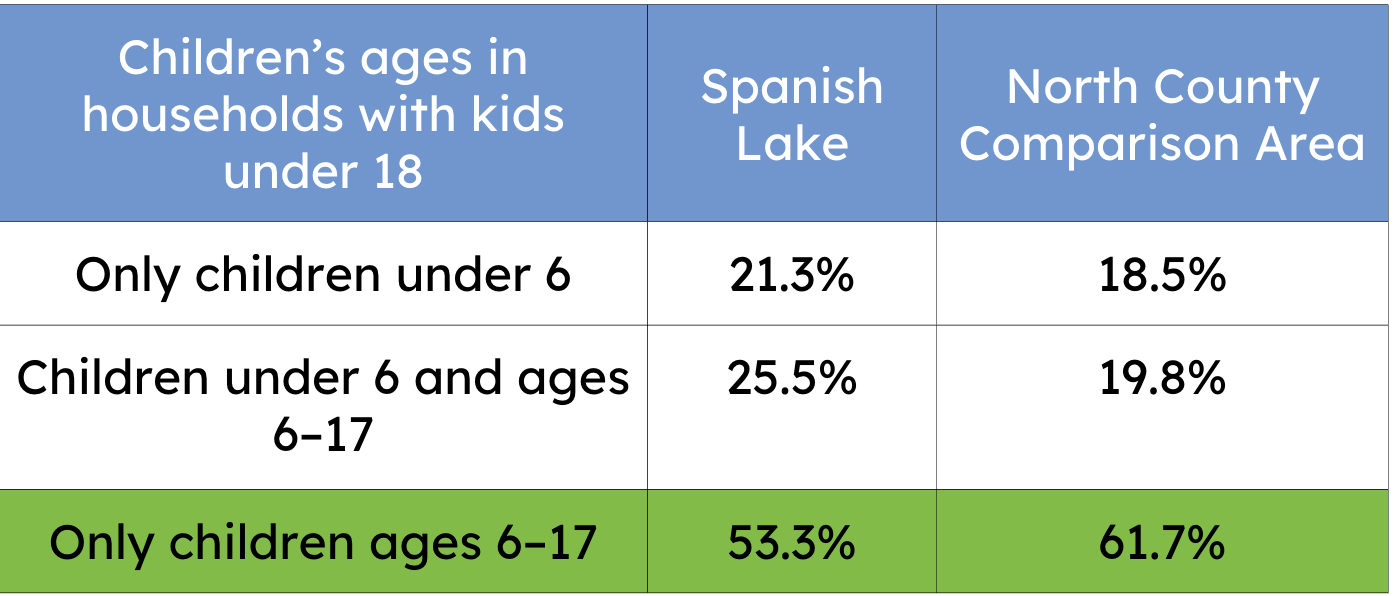
Spanish Lake Study Area vs. North County Comparison Area – Households with Children Under 18 by Age Group of Children, data source: ACS5Y2024 S1101
Support First-time Homeownership
Spanish Lake has more lower-priced homes than the surrounding areas in North County.
This creates an opportunity to help renters and first-time buyers become homeowners, especially when these homes are paired with repair assistance and homebuyer support programs.
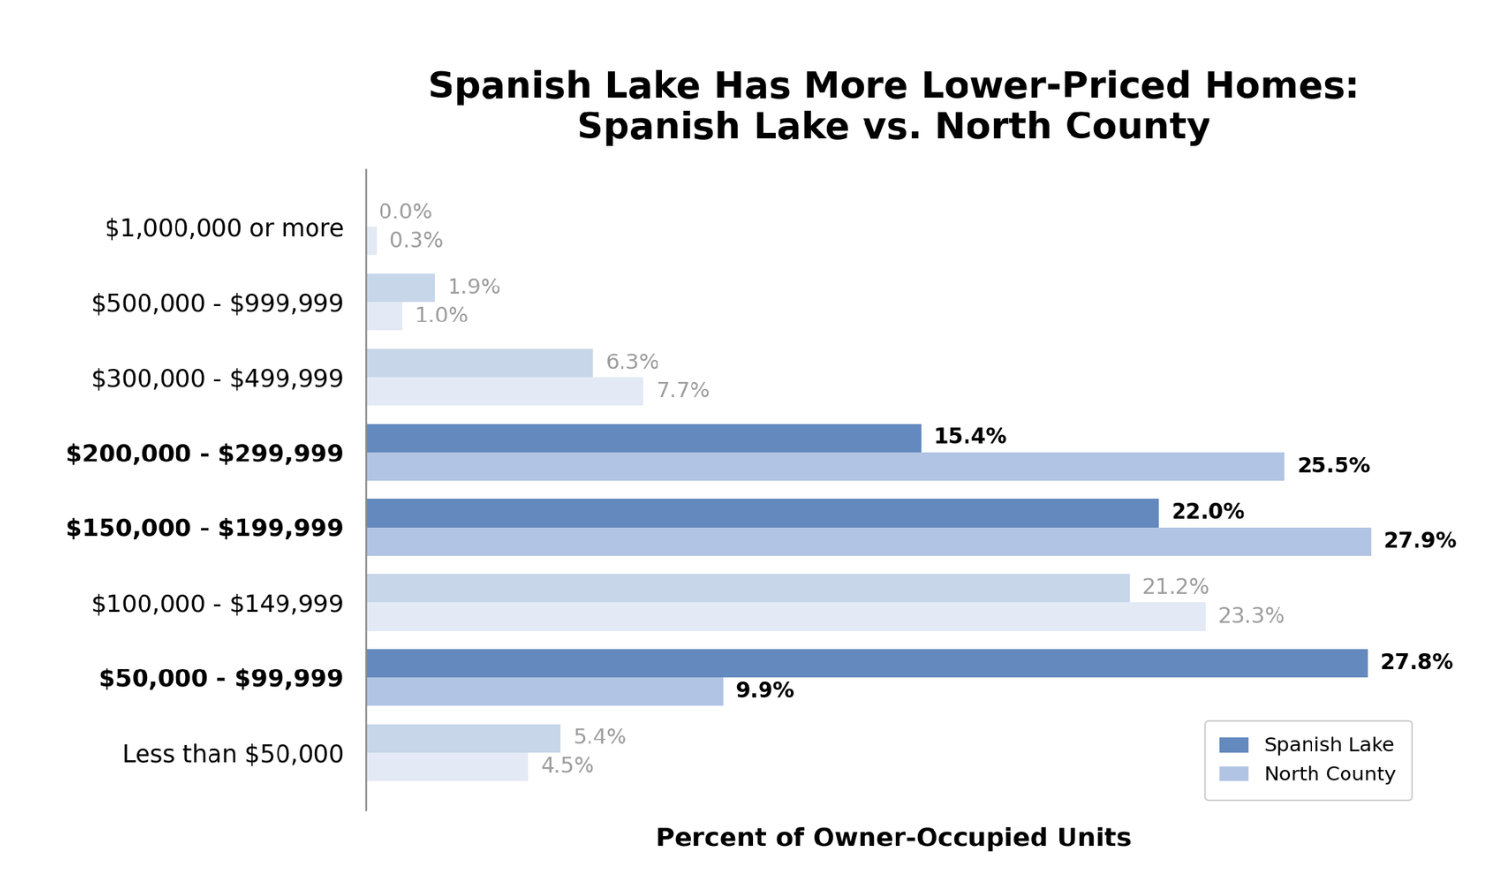
Spanish Lake Study Area vs. North County Comparison Area – Distribution of Owner-Occupied Units by Home Value, data source: ACS5Y2024 DP0
Leverage Rising Property Values
Rising home values present a clear opportunity to attract new investment and build confidence in Spanish Lake.
By focusing on blocks where conditions are already improving, Spanish Lake can create visible momentum and encourage broader reinvestment. Pairing this progress with home repair programs and targeted support can help current residents benefit from increasing values and remain in their homes.
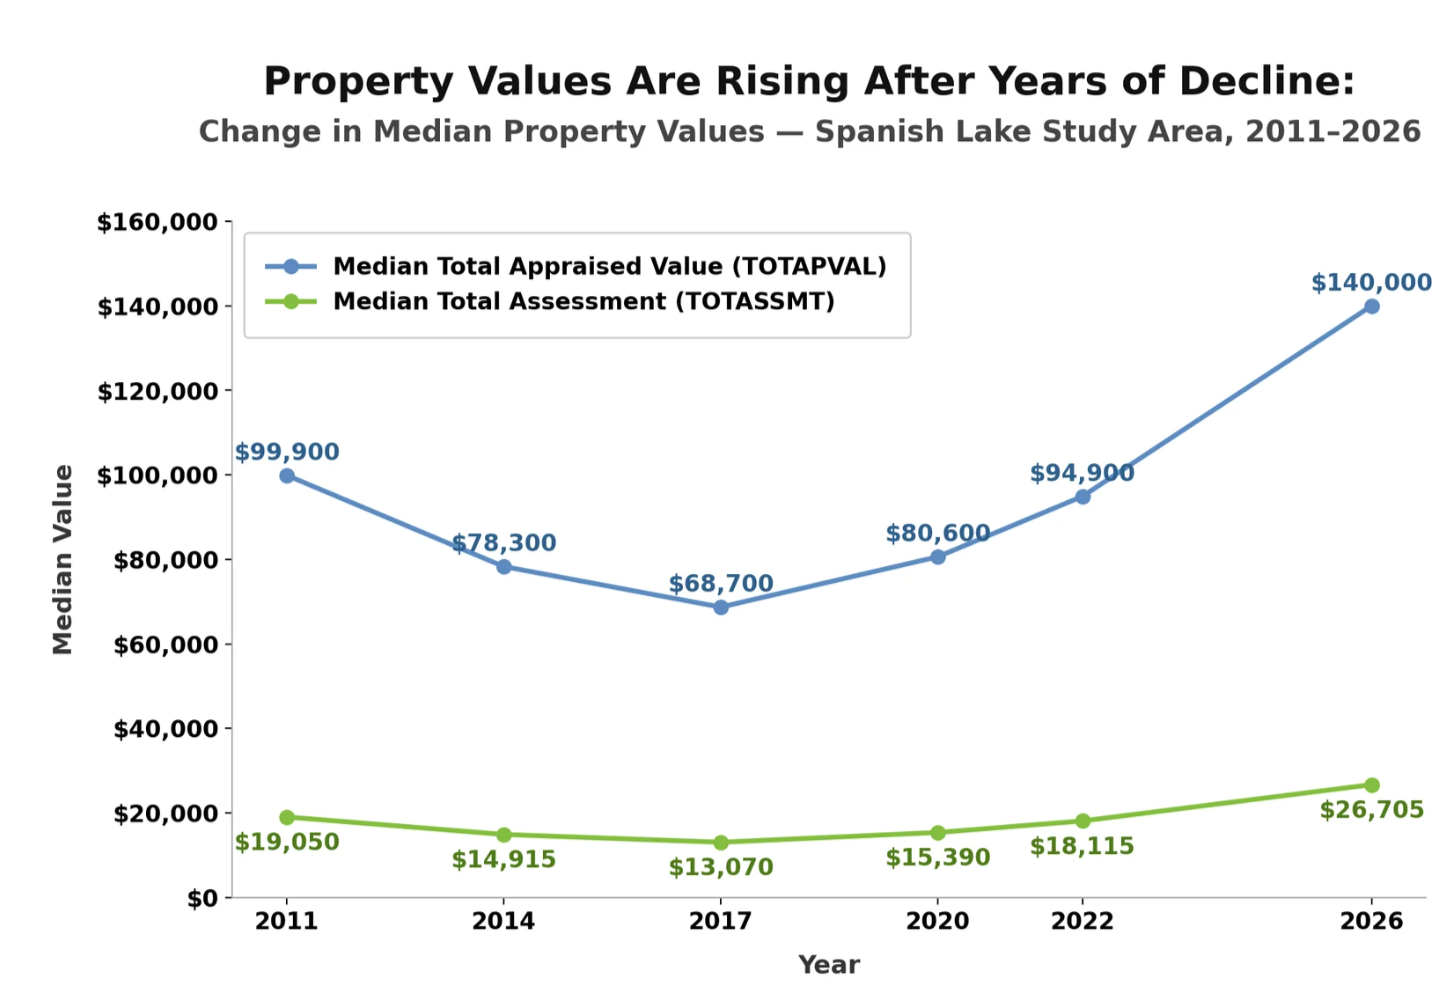
Spanish Lake Study Area – Change in Median Property Values Over Time, data source: 2011- 2026 St. Louis County Parcel Data
Take Advantage of Regional Natural Assets
There is an opportunity to strengthen connections between neighborhoods and nearby destinations like St. Louis Zoo WildCare Park.
Enhanced sidewalks, trails, and bike access can make it easier for residents, and especially youth, to safely enjoy outdoor activities, learning, and play. Trails, parks, and connections to WildCare Park can serve as spaces for youth programming, supporting exploration, education, and healthy activity.
At the same time, reinvestment in existing housing and the addition of new homes nearby can help attract investment and improve quality of life for residents of all ages.
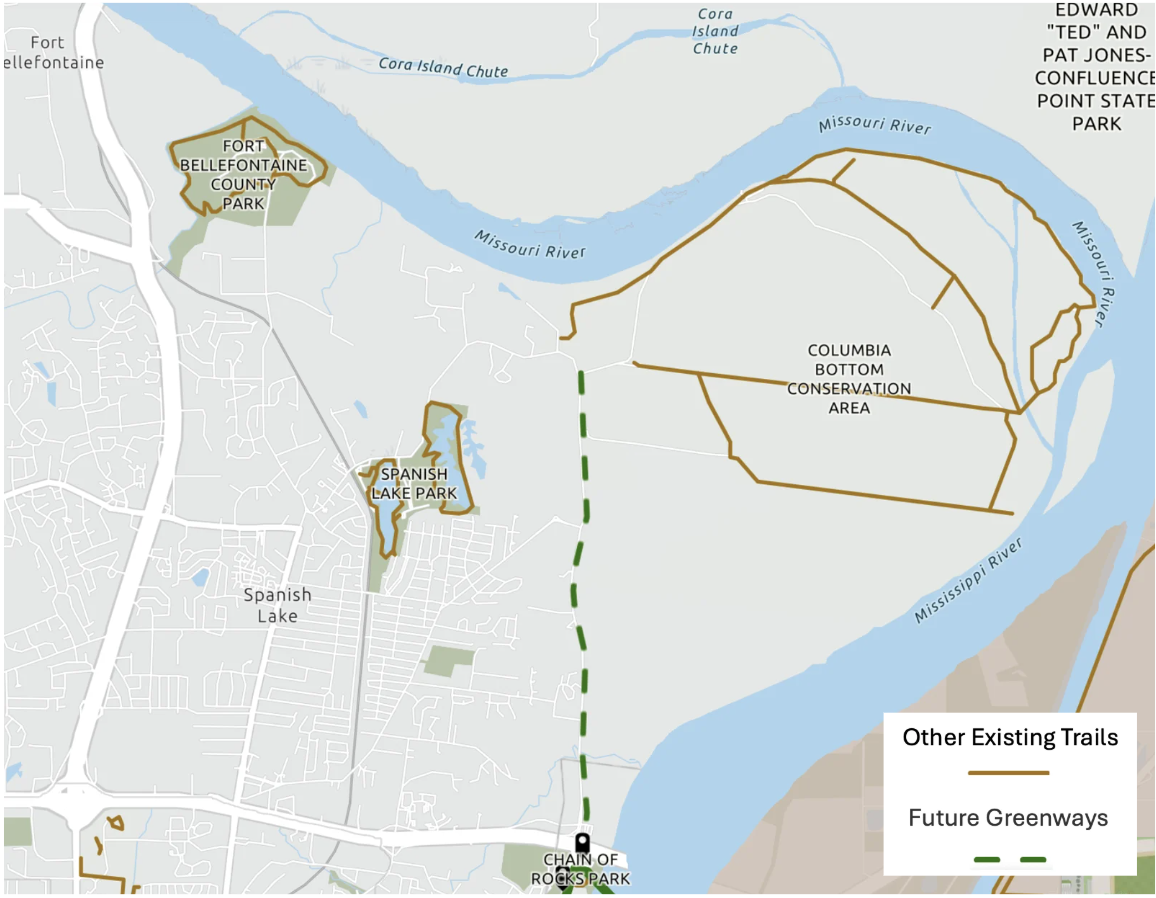
Spanish Lake Study Area – Parks, Natural Assets, and Future Greenways, data source: Great River Greenway Interactive Map